Visual Assistance Indicator
Ideal for both new and experienced traders, the “Visual Assistance” indicator gives a visual representation of high and low values that would be considered horizontal and dynamic support/resistance.

This indicator draws horizontal and dynamic support and resistance

Green = Support

Red = Resistance

Multiple inputs allow for different measurements and color customization

Works on all cryptocurrency, stock, and forex pairs

Runs in REAL TIME on any time frame
R2,200
Introduction Video
Know The Creator

Edward Gonzales
Is a technical analyst, professional day trader and content creator that has been involved in cryptocurrency since April 2017.
Through his passion for cryptocurrency education, he was able to connect with Crypto University and join the team in January 2021. He works closely with the students in our private group to assist in learning and strategy development.
Edward also writes blogs for the university website. Specializing in passive income methods, Edward aims to bring a deeper understanding of algorithmic trading to Crypto University and our students. He’s also the creator of Crypto Automated Trading Course.
Work in Action
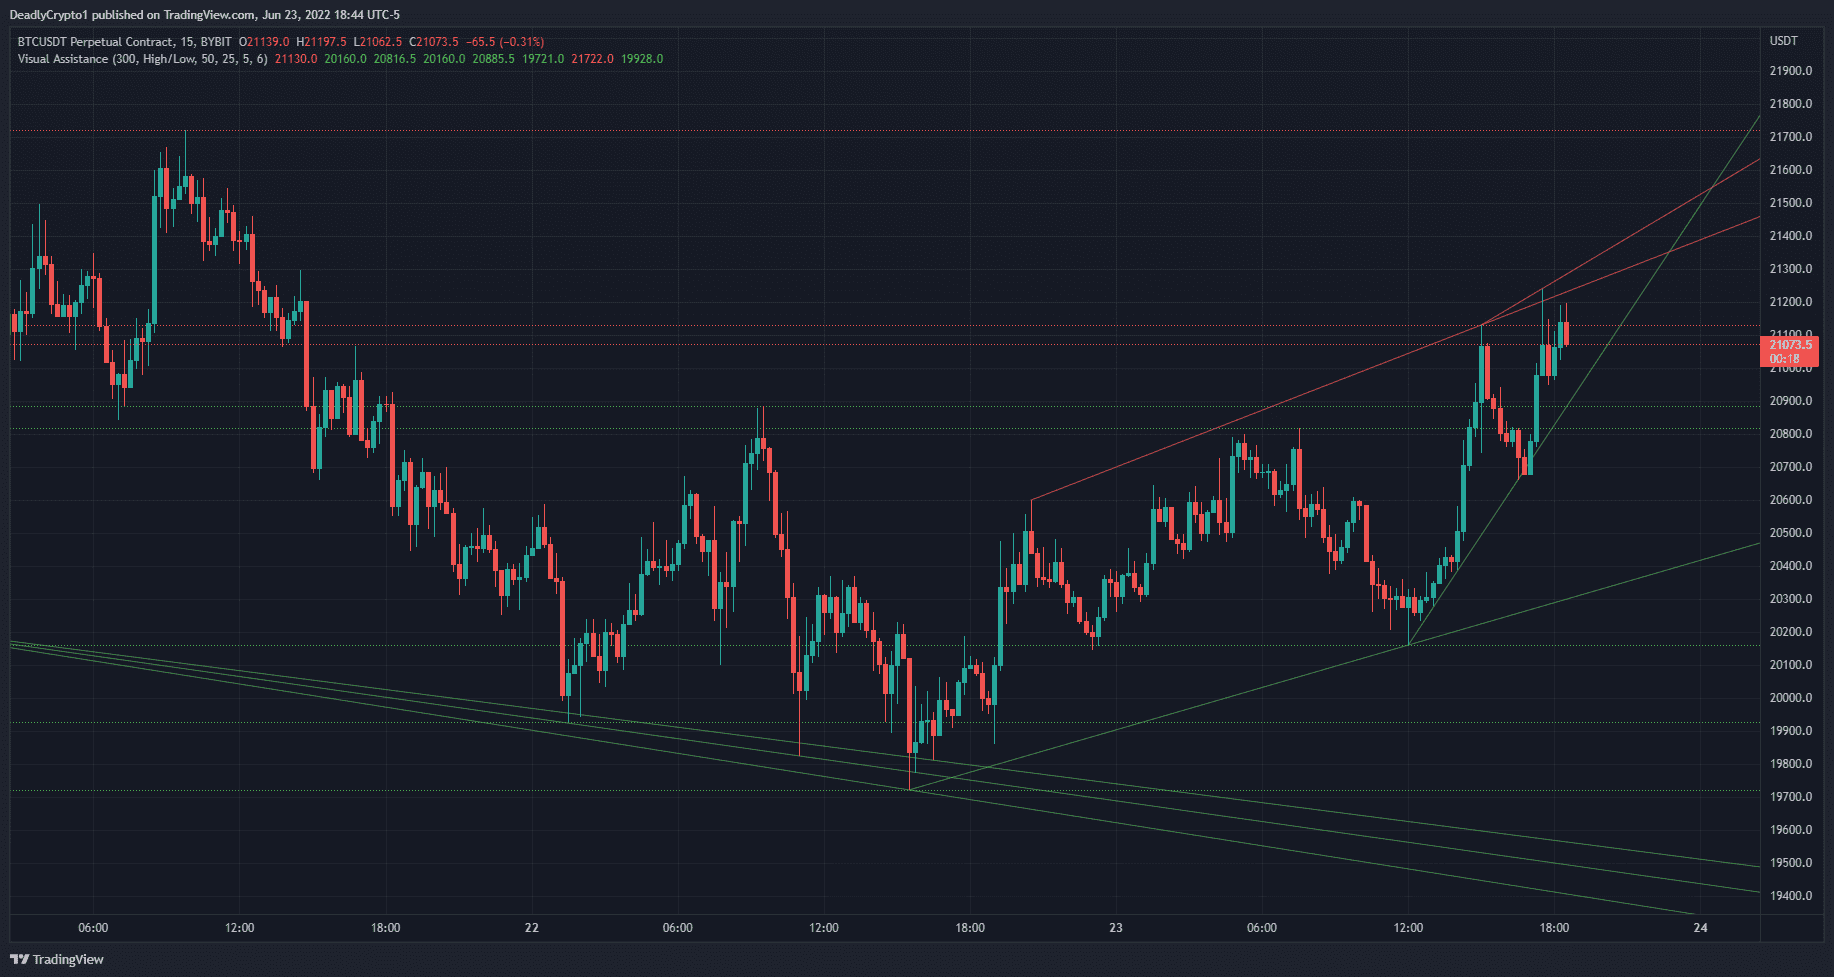
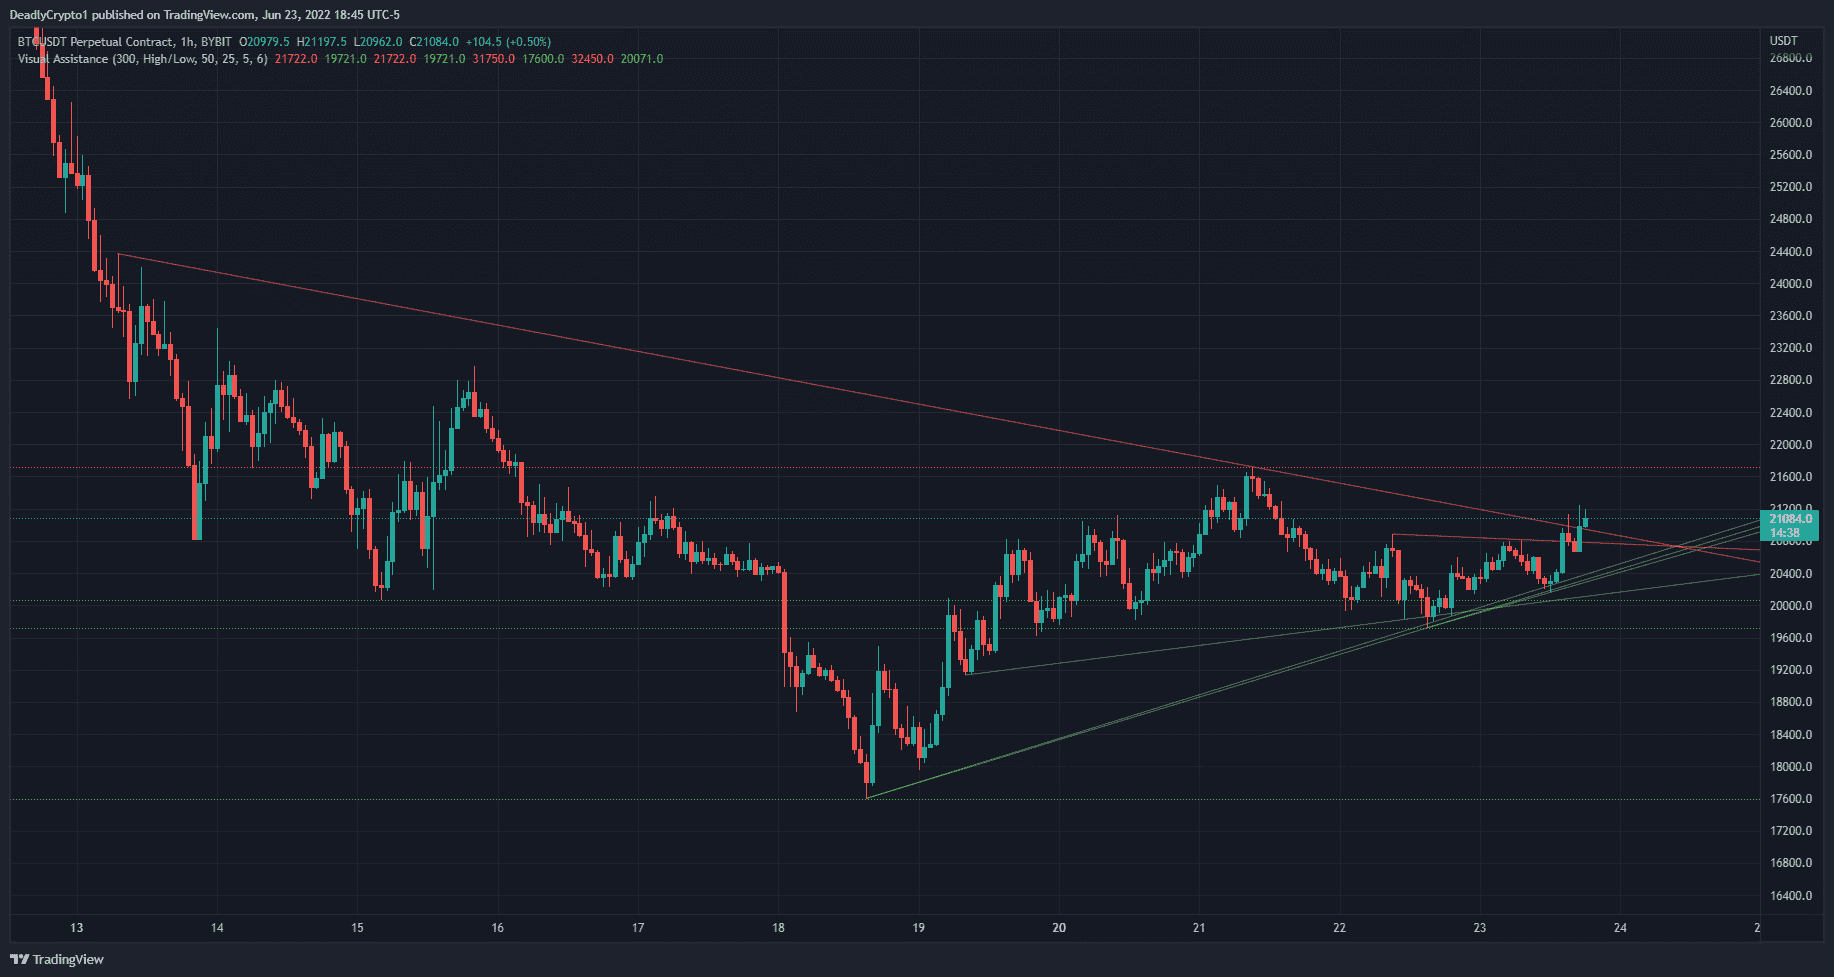
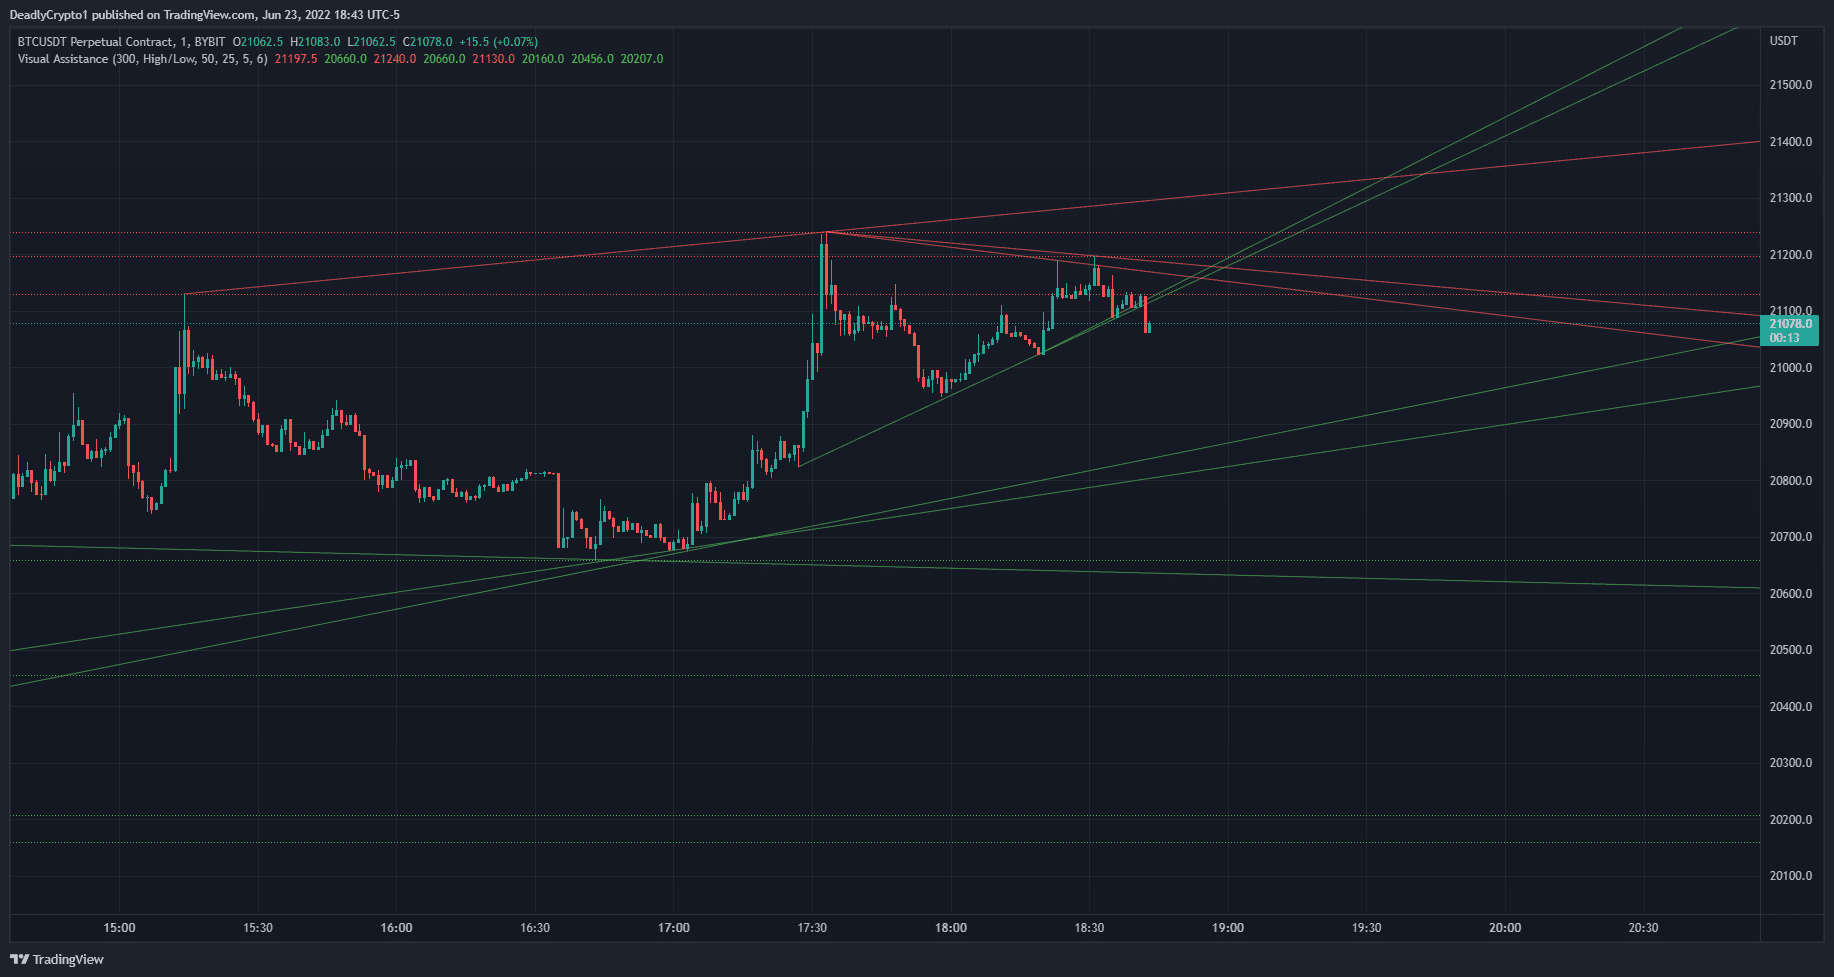
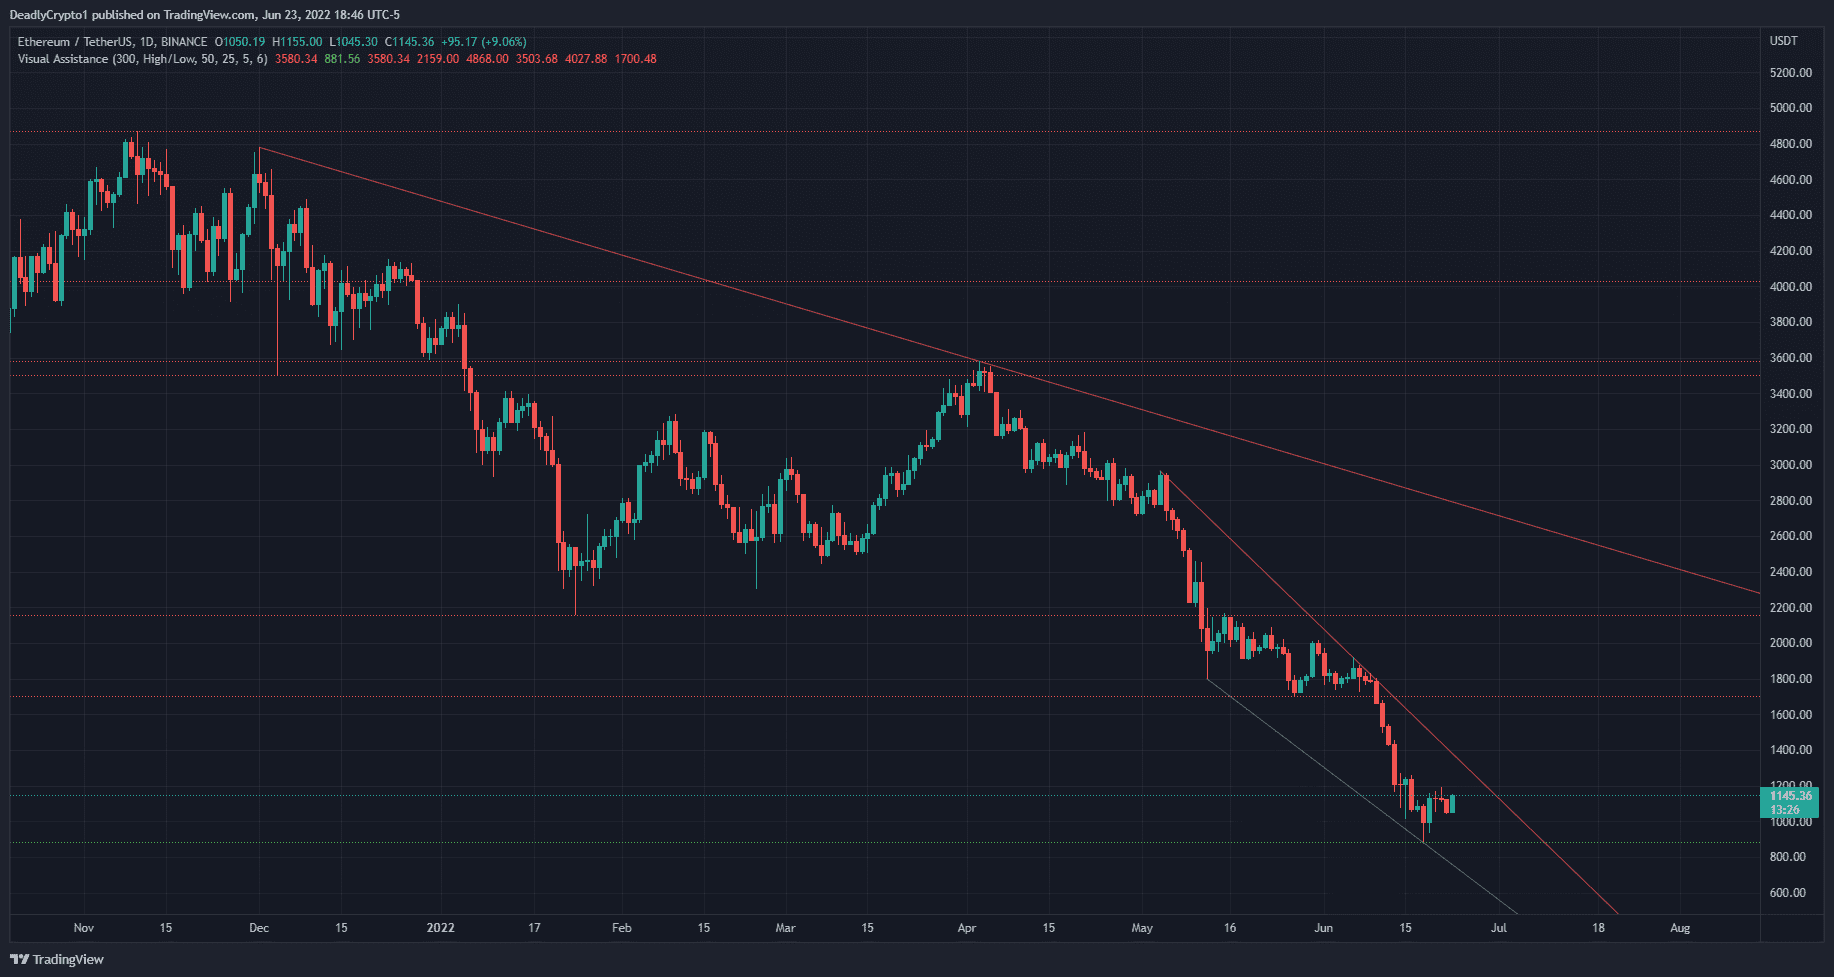
TradingView screenshots which shows how the indicator works
About the Indicator
Ideal for both new and experienced traders, the “Visual Assistance” indicator gives a visual representation of high and low values that would be considered horizontal and dynamic support/resistance.
High/low points in price are projected by horizontal lines (horizontal support/resistance) and sloping lines (dynamic support/resistance).The user has several editable inputs and options explained below.
How it Functions
VISUALS
-
The sloping solid lines are resistance if they are over current price and displayed in red.
-
The sloping solid lines are support if they are below current price and displayed in green.
-
The horizontal dotted lines are resistance if they are over current price and displayed in red. The visibility and color can be edited in the “Style” tab.
-
The horizontal dotted lines are support if they are below current price and displayed in green. The visibility and color can be edited in the “Style” tab.
INPUTS
-
Number of Candles Observed – Represents how many sessions (candlesticks) are being observed.
-
Horizontal Support/Resistance Source – Delegates where the horizontal support/resistance source comes from.
-
Horizontal Support/Resistance Left – Represents how many sessions are being observed left of the pivot high/low.
-
Horizontal Support/Resistance Right – Represents how many sessions are being observed right of the pivot high/low.
-
Horizontal Support/Resistance Precision – Defines how precise the range of values being observed is.
-
Dynamic Support/Resistance Resolution – Defines how many dynamic pivot highs/lows are being observed.
STYLE
- H S/R 1 – This depicts a horizontal line. The visibility and color can be changed. Check this box to enable or disable.
- H S/R 2 – This depicts a horizontal line. The visibility and color can be changed. Check this box to enable or disable.
- H S/R 3 – This depicts a horizontal line. The visibility and color can be changed. Check this box to enable or disable.
- H S/R 4 – This depicts a horizontal line. The visibility and color can be changed. Check this box to enable or disable.
- H S/R 5 – This depicts a horizontal line. The visibility and color can be changed. Check this box to enable or disable.
- H S/R 6 – This depicts a horizontal line. The visibility and color can be changed. Check this box to enable or disable.
- H S/R 7 – This depicts a horizontal line. The visibility and color can be changed. Check this box to enable or disable.
- H S/R 8 – This depicts a horizontal line. The visibility and color can be changed. Check this box to enable or disable.
- Lines – By checking this box you enable/disable dynamic support/resistance lines.
- Precision – N/A value
- Labels On Price Scale – N/A value
- Values In The Status Line – By checking this box you can remove the values from the status line of the indicator.
- NOTE – *The order on screen may different from the numerical value based on support/resistance values. Confirm plot number for alerts by deselecting the values you want alerts for. Do this until your desired line disappears.*
VISIBILITY
-
Set the time frames you would like the strategy back tester to be visible on.
Our philosophy here at Crypto University 🏆

Beginner Friendly
I have learned so much and refined so much of my knowledge about Bitcoin and Altcoins…and just being a more intentional investor than others

Learn at your pace
We have endless amount of content. You pick and choose which area to start with based on your goals or prior experience. You can also refer back to our lessons whenever faced with a challenge.

Community Support
You’ll be part of our Discord server where you can ask questions to experts and other learners.
FAQs
How does the Visual Assistance Indicator work?
The Visual Assistance Indicator makes life a breeze by plotting support and resistance for you.
How do I set up the Visual Assistance Indicator in TradingView?
The indicator is preset to give reasonable values from close range measurements. We recommend you watch this video to understand it completely. Tutorial video
Do I have to pay for TradingView to use the Visual Assistance Indicator?
With a free TradingView account you can use up to three indicators simultaneously at no cost.
I bought the Visual Assistance Indicator but I don’t have access to it. What now?
Access is typically granted within 1-24 hours after purchase. If it has been longer than 24 hours since your purchase, Please join our discord server here and visit our #get-support channel to get a ticket, or send an email to [email protected]
I provided the wrong TradingView username at checkout. How can I change this?
Please join our discord server here and visit our #get-support channel to get a ticket, or send an email to [email protected]
How do I open the Visual Assistance Indicator in TradingView?
Once logged into your TradingView account, select “charts” > “indicators” > “invite only scripts” > add your new indicator to your chart. (Press the star icon to favorite the indicator and make it appear in your favorites section.)
What if I change my TradingView username or lose access to my TradingView account that has the indicator?
Please join our discord server here and visit our #get-support channel to get a ticket, or send an email to [email protected]


