EMA Trading Indicator
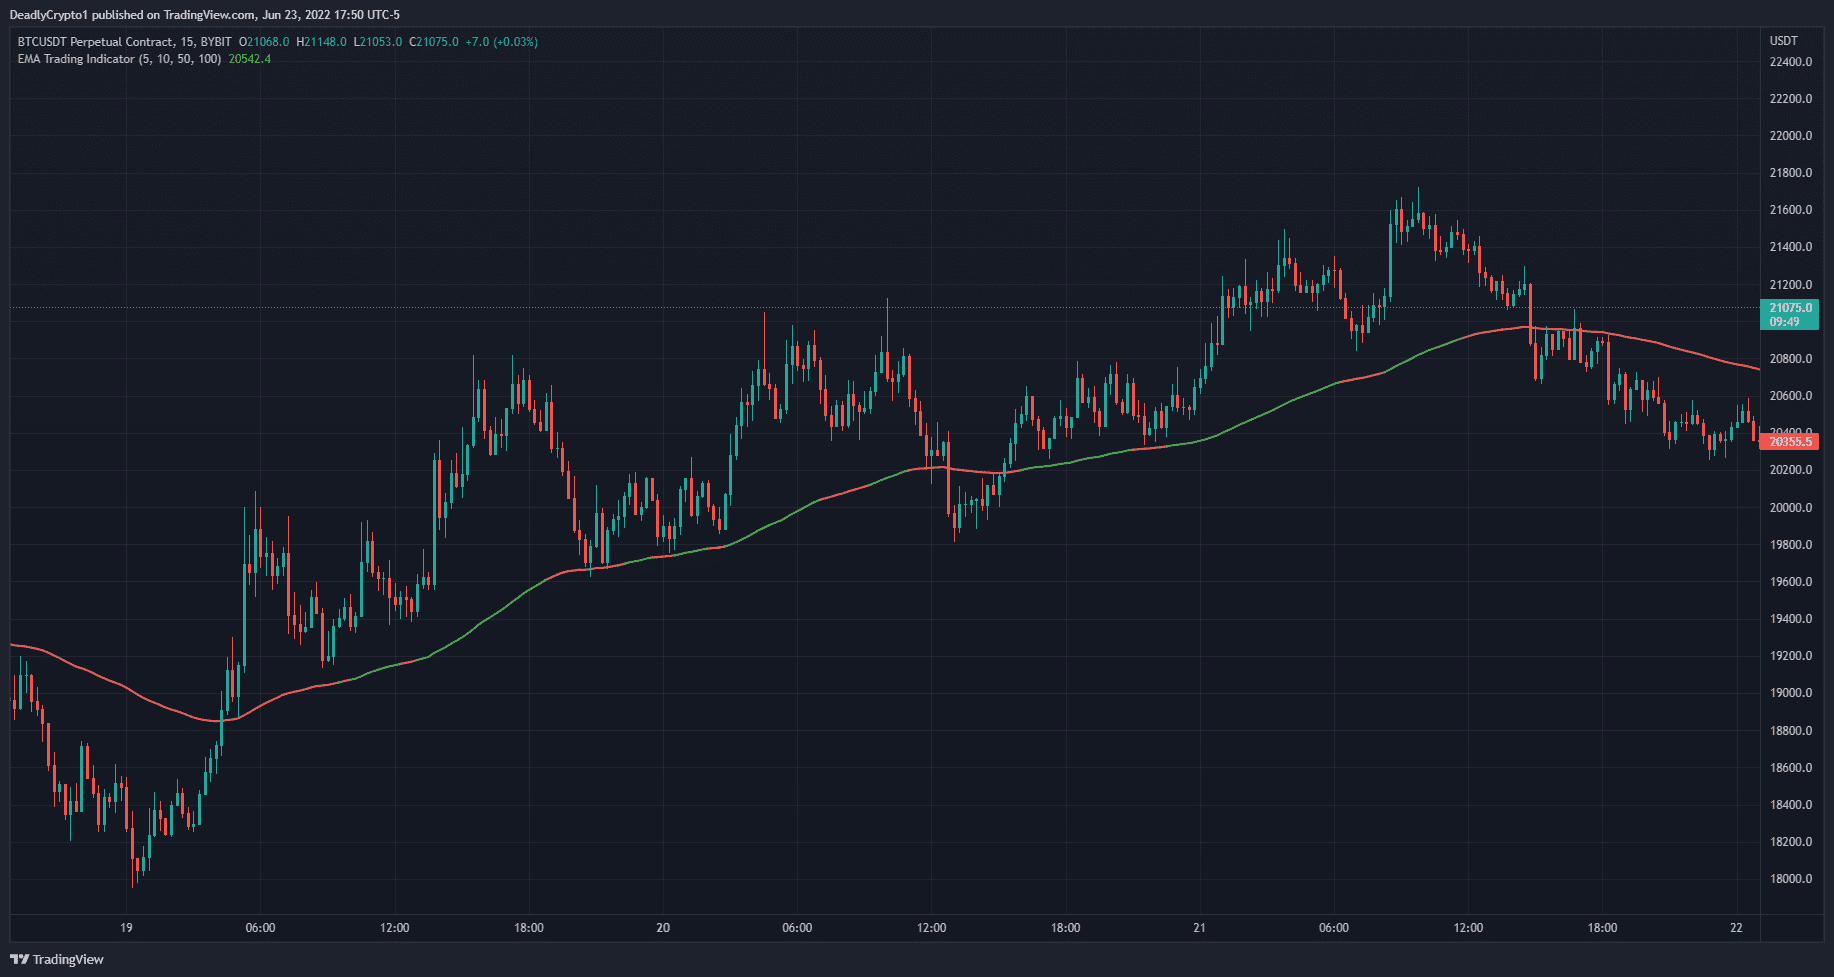
This indicator allows the user to easily interpret the information from multiple EMA’s in a singular line. The line plotted is the last EMA value selected by the user, default value set to 100. The indicator is meant to display a “safe” area for long positions represented by the line being “green”. “Unsafe” areas where an uptrend may be reversing are represented by “orange”.

This indicator shows safe and unsafe areas for long positions

Green = Safe

Red = Not Safe

User inputs for EMA and color customization

Works on all cryptocurrency, stock, and forex pairs

Runs in REAL TIME on any time frame
R2,200
Introduction Video
Know The Creator

Edward Gonzales
Is a technical analyst, professional day trader and content creator that has been involved in cryptocurrency since April 2017.
Through his passion for cryptocurrency education, he was able to connect with Crypto University and join the team in January 2021. He works closely with the students in our private group to assist in learning and strategy development.
Edward also writes blogs for the university website. Specializing in passive income methods, Edward aims to bring a deeper understanding of algorithmic trading to Crypto University and our students. He’s also the creator of Crypto Automated Trading Course.
Work in Action
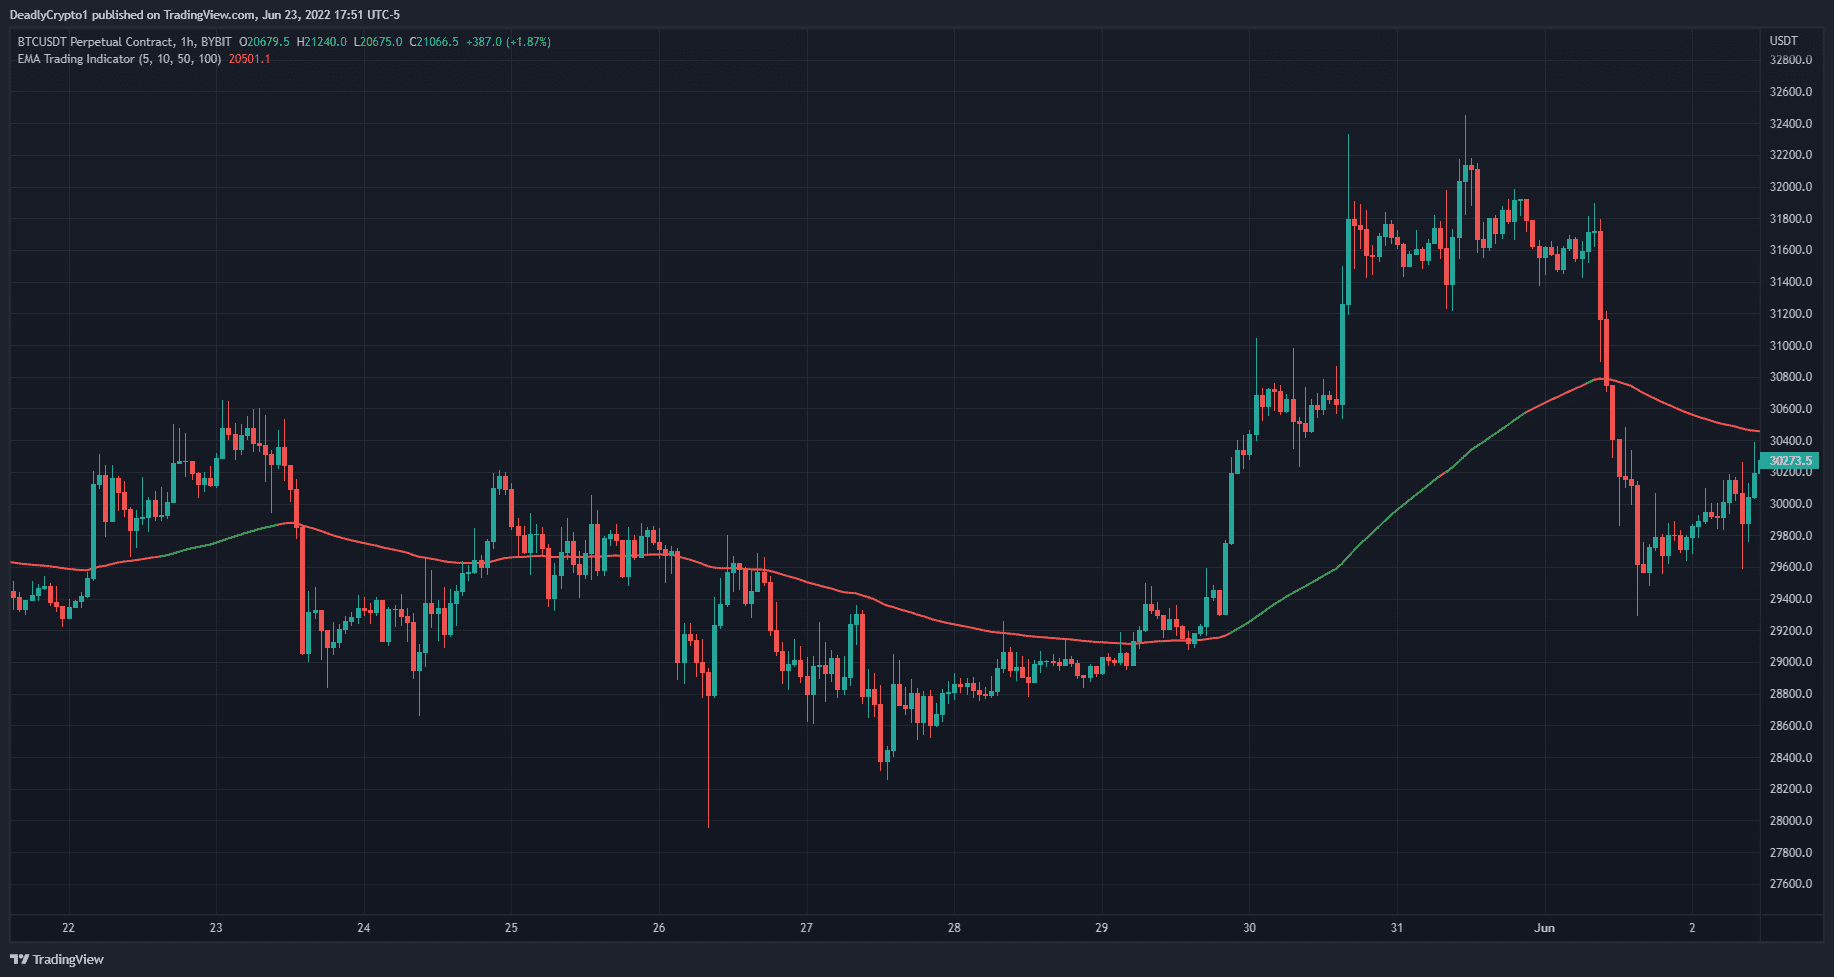
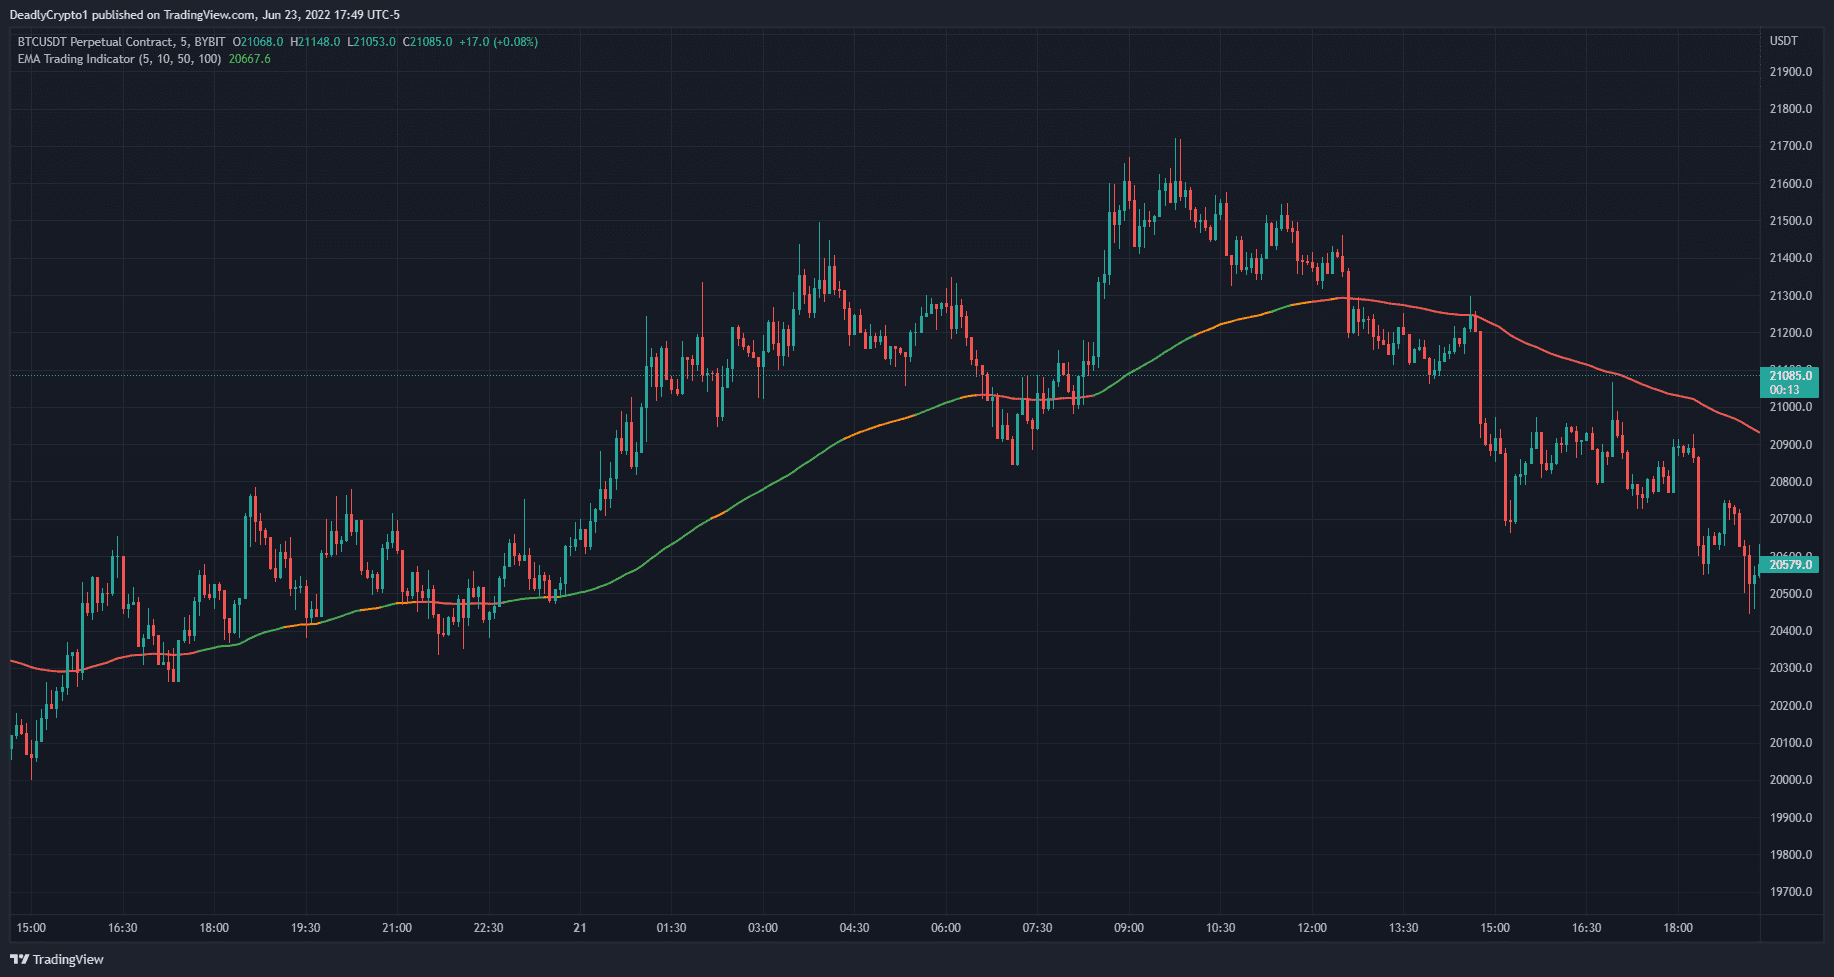
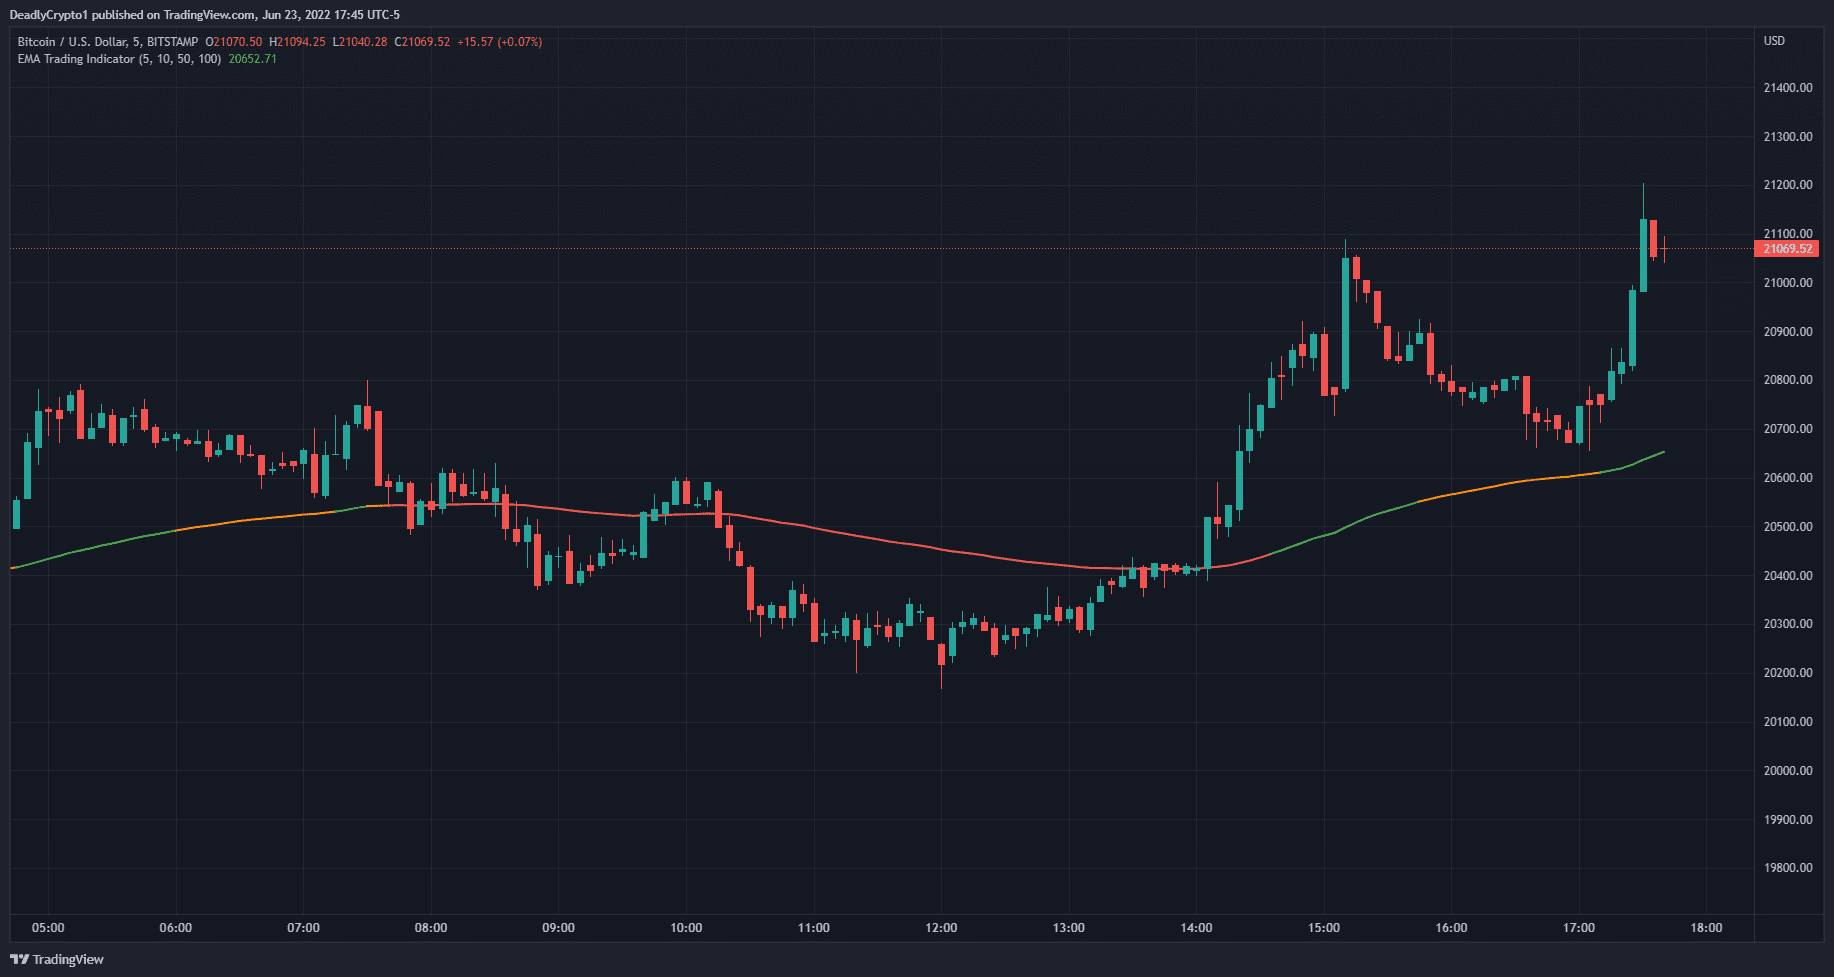
TradingView screenshots which shows how the indicator works
About the Indicator
This indicator allows the user to easily interpret the information from multiple EMA’s in a singular line. The line plotted is the last EMA value selected by the user, default value set to 100. The indicator is meant to display a “safe” area for long positions represented by the line being “green”. “Unsafe” areas where an uptrend may be reversing are represented by “orange”.
If you have an open long position while the line is orange, you may look to close the position. “Not safe” means you should not have a long position open and is indicated by “red”. All of these colors can be changed by the user.
How it Functions
VISUALS
-
Line is green = safe for long positions – EMA 1 length is above every other EMA value specified by the user
-
Line is orange = pay attention to open long positions and prepare for close, do not open new long positions – EMA 1 length is below EMA 2 length but EMA 1 and EMA 2 are still above EMA 3 and EMA 4
-
Line is red = close any open long positions, do not open new long positions – EMA 1 and/or EMA 2 has fallen below EMA 3 and EMA 4
INPUTS
-
EMA 1 Length – This input will change the value of EMA 1
-
EMA 2 Length – This input will change the value of EMA 2
-
EMA 3 Length – This input will change the value of EMA 3
-
EMA 4 Length – This input will change the value of EMA 4
PROPERTIES
- Initial Capital – The amount of capital in the total portfolio. 1,000 by default. Can be changed by the user.
- Base Currency – The currency to be used as base. USD by default. Can be changed by the user.
- Order Size – Field 1) The amount of funds to be used per trade. Field 2) Can be changed to the base currency, percent equity, or contracts purchased/sold.
- Pyramiding – How many orders can be placed for a single trade. 1 by default. Can be changed by the user.
- Commission – Exchange/broker commission rates (maker/taker fee). 0 by default. Can be changed by the user.
- Verify Price For Limit Orders – Number of ticks past limit price that must be reached for a limit order to be filled. 0 by default. Can be changed by the user.
- Slippage – The amount of ticks to be added to the fill price of market stop orders. 0 by default. Can be changed by the user.
- Margin For Long Positions – Percent of equity required to fund long positions. 0 by default. Can be changed by the user.
- Margin For Short Positions – Percent of equity required to fund Short positions. 0 by default. Can be changed by the user.
- Recalculate – After Order Is Filled) Enables an additional intrabar calculation after an order is filled. On Every Tick) Recalculates the strategy on each update of real time bars.
STYLE
-
Plot – By checking this box you turn off/on the plotted line. The colors can be changed by the user.
-
Color 0 – The color used to indicate that EMA 1 is above all other EMAs.
-
Color 1 – The color used to indicate that EMA 1 is under EMA 2, but both EMA 1 and 2 are still above EMA 3 and EMA 4.
-
Color 2 – The color used to indicate that EMA 1 and EMA 2 has fallen below EMA 3 and EMA 4
-
Labels On Price Scale – By checking this box you can add or remove the labels from the price scale.
-
Values In The Status Line – By checking this box you can remove the values from the status line of the indicator.
VISIBILITY
-
Set the time frames you would like the strategy back tester to be visible on.
Our philosophy here at Crypto University 🏆

Beginner Friendly
I have learned so much and refined so much of my knowledge about Bitcoin and Altcoins…and just being a more intentional investor than others

Learn at your pace
We have endless amount of content. You pick and choose which area to start with based on your goals or prior experience. You can also refer back to our lessons whenever faced with a challenge.

Community Support
You’ll be part of our Discord server where you can ask questions to experts and other learners.
FAQs
How does the EMA Trading indicator work?
The EMA Trading indicator allows the user to see multiple EMA values represented by a single line with green and red indications.
How do I set up the EMA Trading Indicator in TradingView?
You can configure this a few ways – the default values are sufficient for most times frames. We recommend you watch this video to understand it completely. Tutorial video
Do I have to pay for TradingView to use the EMA Trading Indicator?
With a free TradingView account you can use up to three indicators simultaneously at no cost.
I bought the EMA Trading Indicator but I don’t have access to it. What now?
Access is typically granted within 1-24 hours after purchase. If it has been longer than 24 hours since your purchase, Please join our discord server here and visit our #get-support channel to get a ticket, or send an email to [email protected]
I provided the wrong TradingView username at checkout. How can I change this?
Please join our discord server here and visit our #get-support channel to get a ticket, or send an email to [email protected]
How do I open the EMA Trading Indicator in TradingView?
Once logged into your TradingView account, select “charts” > “indicators” > “invite only scripts” > add your new indicator to your chart. (Press the star icon to favorite the indicator and make it appear in your favorites section.)
What if I change my TradingView username or lose access to my TradingView account that has the indicator?
Please join our discord server here and visit our #get-support channel to get a ticket, or send an email to [email protected]


