Candlestick charts look intimidating at first, but they’re actually one of the easiest ways to see what price did during a certain chunk of time. Once you get the basics, you’ll stop feeling lost on a chart and start understanding the story price is telling.
This guide is short, simple, and made for total beginners. No fancy terms—just plain talk and visuals you can picture right away.
What a Candlestick Chart Really Is (and Why People Use It)
A candlestick chart shows how price moved over a specific time period (like 1 hour, 1 day, etc.). Each candle packs four important numbers into one easy shape:
Open: the price when the period started
High: the highest price reached
Low: the lowest price reached
Close: the price when the period ended
These four numbers are called OHLC. Together they tell you:
Did price go up or down?
How much did it swing around?
Did buyers or sellers win by the end?
Candlesticks don’t predict the future—they just show what already happened in a clear, visual way. That’s why traders love them.
The Most Important Thing First: Timeframes
Every single candle represents one timeframe. Popular ones are:
1 minute (very short, lots of noise)
5 minutes
1 hour
4 hours
1 day
1 week
Switching timeframes doesn’t change the real prices—it just groups them into bigger or smaller blocks. A crazy pattern on a 5-minute chart might disappear completely on the daily chart.
Beginner tip: Stick to bigger timeframes like 4-hour or daily when you’re learning. They cut out random wiggles and show the real story better.
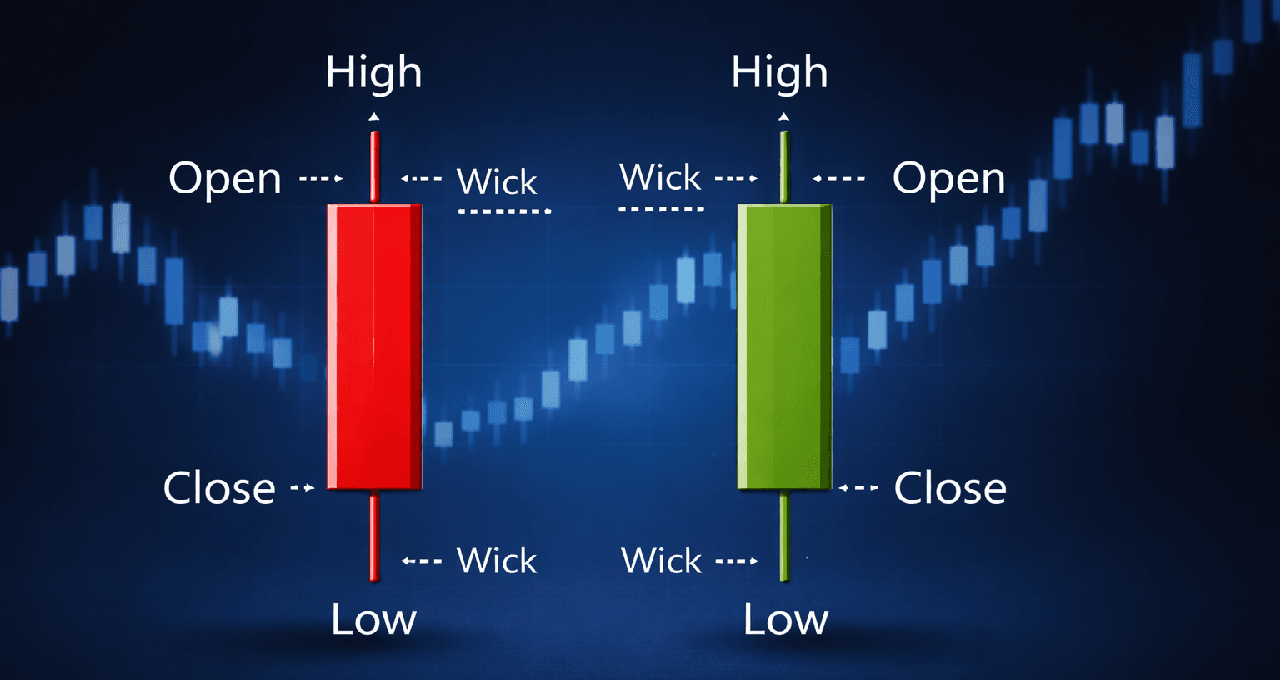
Candlestick Anatomy – Explained Like You’re Five
Every candle has two main parts:
The body – the thick colored rectangle
Shows the difference between open and close prices.The wicks (also called shadows) – the thin lines sticking out top and bottom
Show the high and low prices reached during that time.
Color rules (most platforms use these):
Green (or white): Close is higher than open → price went up
Red (or black): Close is lower than open → price went down
Quick OHLC mapping table for one candle:
Part of Candle | Green Candle (Up) | Red Candle (Down) | What It Shows |
Top of upper wick | High | High | Highest price reached |
Top of body | Close | Open | End or start price |
Bottom of body | Open | Close | Start or end price |
Bottom of lower wick | Low | Low | Lowest price reached |
How to Read Any Single Candle in Under 10 Seconds
Run through this quick checklist:
Open vs close – which won? (body color tells you)
Body size – big body = strong move, small body = indecision
Wick length – long wicks = price got rejected and pushed back
Where is this candle sitting? (next to recent highs/lows or in the middle of nowhere?)
One candle by itself almost never means “buy” or “sell.” It only makes sense when you look at what came before and after.
What Different Candle Sizes Tell You
Big body = strong fight in one direction during that period (buyers or sellers dominated).
Small body = tug-of-war, nobody won clearly (often indecision).
Wicks matter a lot too:
Long upper wick = price tried to go higher but got slammed down (sellers rejected higher prices)
Long lower wick = price tried to drop but buyers pushed it back up (buyers rejected lower prices)
Wicks show rejection, but they’re not automatic signals—context is everything.
Two Things That Make Candlesticks 10x More Useful: Trend + Key Levels
Don’t read candles in a vacuum. Always zoom out and ask:
What’s the trend?
Uptrend: making higher highs and higher lows
Downtrend: lower highs and lower lows
Sideways/range: bouncing between two levels
Is the candle near a key level?
Key levels are spots price often reacts to, like:Previous big highs or lows
Round numbers (e.g., Bitcoin at $50,000 or $100,000)
Zones where price sat for a long time
Patterns near these levels carry way more weight than random candles in the middle of nowhere.
6 Beginner-Friendly Candlestick Patterns (With Real Talk on Limits)
Think of these as common “looks” price makes—not magic spells.
Doji – open and close almost the same (tiny body)
→ Shows indecision or balance.
Mistake: Thinking every doji means reversal. In a strong trend it’s just a breather.Hammer – small body at the top, long lower wick (after a drop)
→ Buyers stepped in hard and rejected lower prices.
Best when: near support after a down move. Wait for next candle to confirm.Shooting Star – small body at the bottom, long upper wick (after a rise)
→ Sellers rejected higher prices.
Best when: near resistance after an up move.Engulfing – big candle that completely covers the previous one
Bullish: green engulfs previous red
Bearish: red engulfs previous green
→ Momentum flipped hard.
Limitation: Happens a lot in choppy markets and fails often.
Inside Bar – current candle’s high/low stays inside the previous candle’s range
→ Volatility shrinking, possible big move coming.
Limitation: Doesn’t tell you which way it will break.Repeated Long Wicks at Same Level
→ Multiple candles getting rejected at the same price zone.
Simple and powerful: shows real buying or selling pressure there.
Easy Beginner Workflow – Keep It Simple
Pick a calm timeframe (start with daily or 4-hour)
Draw 2–3 obvious recent highs and lows (don’t overdraw lines)
Watch how candles act when they hit those levels
Long wicks = rejection
Strong body close beyond level = possible breakout
Always wait for follow-through (one candle rarely enough)
This keeps you focused on structure instead of guessing.
Common Beginner Mistakes That Ruin Candlesticks
Memorizing dozens of patterns but ignoring context
Looking at 1-minute charts too soon (too noisy)
Treating every candle as a prediction instead of history
Cherry-picking timeframes until a pattern “appears”
Ignoring volume, news, or weekend gaps in crypto
Quick Glossary for New Traders
OHLC: Open, High, Low, Close
Body: Thick part showing open-to-close range
Wick/Shadow: Thin lines showing extreme highs/lows
Support: Price zone where falling often stops
Resistance: Price zone where rising often stops
Beginner FAQ
Are candlestick patterns reliable?
They describe what happened well, but never guarantee what’s next. Context and confirmation matter most.
Best timeframe for beginners?
Daily (1D) or 4-hour (4H). Less noise, clearer story than minute charts.
What does a long wick mean?
Price ran in one direction but got pushed back before the candle closed—usually rejection by the other side.
Hammer vs Doji?
Hammer has a small body + long lower wick (potential bottom reversal). Doji is tiny body only (pure indecision).
Do candlesticks work the same in crypto as stocks?
Yes for basics. Crypto runs 24/7 so no “open/close” sessions, which can make patterns act a bit differently.
Need deeper training?
Join our structured modules with live examples and expert checklists for effective implementation.
JOIN THE ACADEMY