Key Takeaways
The index is a thermometer, not a forecast. The Fear & Greed Index compresses volatility, volume, social activity, and other inputs into one number from 0 to 100. It describes how the crowd feels today. It does not predict what prices do tomorrow.
Different providers publish different numbers. On the same day in early July 2026, major trackers showed readings ranging from the low teens to the mid 40s. Always check which methodology a site uses before reacting to its number.
Sentiment data is most useful when cross-checked. Extreme Fear readings mean more, or less, depending on what harder data shows. Spot Bitcoin ETF flows and on-chain metrics like the MVRV ratio are the natural cross-references.
Why Sentiment Data Suddenly Matters Again
In early July 2026, the crypto Fear & Greed Index sat deep in Extreme Fear territory, with widely cited readings in the low 20s. Bitcoin had dropped below 58,000 dollars, a level several outlets described as a 21-month low, before rebounding above 61,000 dollars within days. Then the data whiplashed. On July 3, US spot Bitcoin ETFs recorded a net inflow of 221.7 million dollars, their largest daily intake in about two months, ending a 10-day outflow streak that had drained roughly 2.73 billion dollars from the funds.
So which signal is right? The sentiment gauge screaming fear, or the fund flows showing fresh buying? Neither one is a prediction. They measure different things at different points in the market's plumbing, and learning to read them together is one of the most useful skills an intermediate crypto user can build. This guide treats the Fear & Greed Index as exactly what it is: a piece of market media to read critically.
What the Fear & Greed Index Actually Measures
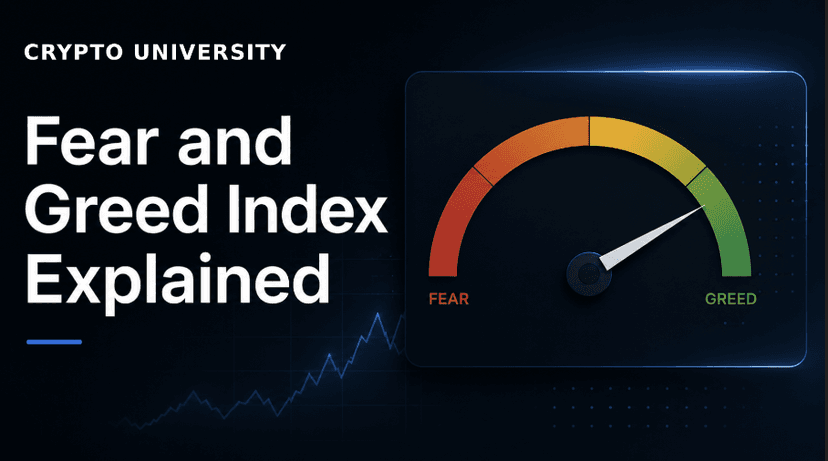
The original and most widely quoted crypto Fear & Greed Index is published by Alternative.me and focuses on Bitcoin sentiment. It aggregates several data sources into a single daily score from 0 (Extreme Fear) to 100 (Extreme Greed). The commonly cited component weights are below.
Component | Weight | What it captures |
|---|---|---|
Volatility | 25% | Current volatility and drawdowns compared with 30-day and 90-day averages. Unusual spikes are read as fear. |
Momentum and volume | 25% | Buying and selling volume relative to recent averages. Heavy buying volume is read as greed. |
Social media | 15% | Post volume and interaction rates on platforms such as X and Reddit. Unusually high engagement is read as greed. |
Surveys | 15% | Periodic polls of crypto investors about market direction. |
Bitcoin dominance | 10% | Bitcoin's share of total crypto market capitalization. Rising dominance is read as a flight to relative safety, meaning fear. |
Google Trends | 10% | Search interest in Bitcoin-related queries, including the tone of trending searches. |
Scores are bucketed into zones: roughly 0 to 24 is Extreme Fear, 25 to 49 is Fear, 50 to 74 is Greed, and 75 to 100 is Extreme Greed. Exact boundaries vary by provider.
What the Index Does and Does Not Tell You
The index can tell you | The index cannot tell you |
|---|---|
How stretched crowd emotion is right now | Where the price will be next week or next month |
Whether sentiment is deteriorating or recovering day over day | Whether an asset is undervalued or overvalued |
When headlines and social feeds are likely to be at their most emotional | Whether institutions are buying or selling |
Useful context for interpreting other data | Anything about a specific altcoin, since most versions track Bitcoin |
The most common misuse of the index is treating it as an automatic contrarian signal. The slogan says to be greedy when others are fearful, but Extreme Fear can persist for weeks while prices keep falling. In mid 2026, several trackers showed the index pinned in Extreme Fear for close to a month. Anyone who treated the first Extreme Fear print as a buy signal spent that entire stretch underwater. Fear readings describe conditions. They do not time bottoms.
Why Different Sites Show Different Numbers
On a single day in early July 2026, one aggregator showed the index at 27, another at 23, a third at 44, and coverage of the Alternative.me index cited readings between 15 and 21 across the same week. None of these sites were wrong. They measure different inputs.
Alternative.me leans on volatility, volume, social activity, surveys, dominance, and search trends. CoinMarketCap's version incorporates derivatives data such as the put/call ratio in Bitcoin and Ethereum options, implied volatility indices, and the stablecoin supply ratio. Other trackers score more than 100 assets individually and across multiple timeframes. The practical lesson is simple: never quote a Fear & Greed number without knowing which index it comes from, and never compare today's reading from one provider with last week's reading from another.
Case Study: Early July 2026, When the Signals Disagreed
The week of June 29 to July 5, 2026 is a clean example of why cross-referencing matters. The sentiment picture was grim: Extreme Fear readings, a price break below 58,000 dollars, and a steady drumbeat of negative headlines. The flow picture then turned: a 221.7 million dollar net inflow into US spot Bitcoin ETFs on July 3, led by Fidelity's FBTC with about 166 million dollars, while BlackRock's IBIT actually recorded an outflow of around 40 million dollars that day.
A careless reading says fear is over and the bottom is in. A careful reading notes three things. First, one inflow day is not a trend; the same funds had shed about 2.73 billion dollars over the prior 10 sessions, and year-to-date net outflows were still around 5.4 billion dollars. Second, the inflow was concentrated in a few funds rather than broad-based. Third, the sentiment index and ETF flows measure different populations: the index skews toward retail attention and market mechanics, while ETF flows reflect decisions by institutions and advised investors. When they disagree, the conclusion is not that one is lying. Different participants are behaving differently, which is itself useful information.
Cross-Reference 1: Spot Bitcoin ETF Flows
Daily net flows into US spot Bitcoin ETFs show whether regulated investment products are, on net, buying or selling Bitcoin. Aggregated dashboards from SoSoValue, CoinGlass, and Farside Investors publish these figures each trading day. Two habits keep this data honest. Watch streaks, not single days, since a lone inflow after 10 outflow days is a pause, not a reversal. And keep scale in mind: even the multi-billion dollar outflow streaks of mid 2026 represented only a few percent of the roughly 100 billion dollars these products held, and lifetime net inflows since the January 2024 launch remained strongly positive at widely reported figures near 58 billion dollars.
Cross-Reference 2: MVRV and Realized Price
MVRV stands for Market Value to Realized Value. Market value is Bitcoin's ordinary market capitalization. Realized value prices every coin at the level it last moved on-chain, which approximates the aggregate cost basis of all holders. Dividing one by the other tells you, roughly, how much unrealized profit or loss the average holder is sitting on. An MVRV well above 1 means the average coin is in profit. A reading near or below 1 means the average holder is at or under their cost basis, a condition that has historically appeared near major cycle lows, though past patterns are not guarantees.
The related metric, realized price, is the per-coin version of realized value. In early July 2026, analysts widely cited a realized price near 52,000 to 53,000 dollars while Bitcoin traded around 58,000 to 62,000 dollars. That framing is more informative than any fear score: it tells you how far price sits from the aggregate cost basis, which is a structural fact rather than a mood. Glassnode and CryptoQuant both publish MVRV and realized price charts.
Cross-Reference 3: Exchange Netflows
Exchange netflow tracks whether coins are moving onto exchanges, where they can be sold, or off exchanges into self-custody. Sustained large inflows to exchanges often accompany selling pressure. During the early July 2026 turbulence, CryptoQuant analysts flagged Bitcoin inflows to exchanges exceeding 50,000 coins per day, with rising average deposit sizes suggesting large holders rather than retail. Reading this next to the fear index adds texture: sentiment was fearful, and some large holders were positioning to sell, while ETF buyers were stepping back in. Markets are rarely one mood.
A Five-Step Routine for Reading Extreme Fear
Identify the index. Note which provider's number you are looking at and skim its methodology page once.
Check the trend, not the level. Compare today's reading with the past 7 and 30 days. A move from 40 to 20 tells a different story than a month pinned at 20.
Pull the ETF flow data. Look at the last 10 trading days of net flows. Ask whether flows confirm or contradict the sentiment reading.
Check one on-chain metric. MVRV or realized price is enough. Ask where price sits relative to aggregate cost basis.
Write down what you see before reading commentary. Form your own one-sentence summary of the data, then compare it with headlines. The gap between the two is where hype lives.
The Media Literacy Rule
Every Extreme Fear print generates two waves of content: panic pieces telling you the market is collapsing, and contrarian pieces calling it the buying opportunity of the year. Both react to the same single number, usually within hours of it printing. The index makes no claim about the future, and neither should you on its basis alone. Treat sentiment scores the way a careful reader treats an opinion poll: a snapshot of feelings, with a methodology, an error range, and no authority over what happens next. Nothing here is financial advice. It is a guide to reading data that most people only react to.
FAQ
What does an Extreme Fear reading on the crypto Fear & Greed Index mean?
It means the index's inputs, such as volatility, volume, social activity, and search trends, currently resemble past periods of market stress. It is a description of present conditions, not a prediction of future prices.
Is Extreme Fear a buy signal?
Not by itself. Extreme Fear has historically appeared near some market bottoms, but it has also persisted for weeks during extended declines. Sentiment readings work best as context alongside flow data and on-chain metrics, and no combination of indicators guarantees an outcome.
Why do different websites show different Fear & Greed numbers?
Because they are different indices. Alternative.me, CoinMarketCap, and other trackers use different inputs and weights, so daily readings can differ by 20 points or more. Always note the source before comparing numbers.
How often is the Fear & Greed Index updated?
Most versions update at least daily. Some providers refresh every 12 hours or publish intraday readings on 15-minute to 4-hour intervals.
Where can I track spot Bitcoin ETF flows and MVRV for free?
SoSoValue, CoinGlass, and Farside Investors publish daily US spot Bitcoin ETF flow data. Glassnode and CryptoQuant offer free tiers that include MVRV, realized price, and exchange netflow charts.
Disclaimer: This content is for educational and informational purposes only and is not financial advice. Nothing here is a recommendation to buy or sell any asset or use any platform. Do your own research and manage your risk.
AI Agents in Crypto Wallets: Technical Foundations and Security Considerations
Tokenized Assets Go Institutional: What Standard Chartered's 2028 Projection Means for Web3 Learners